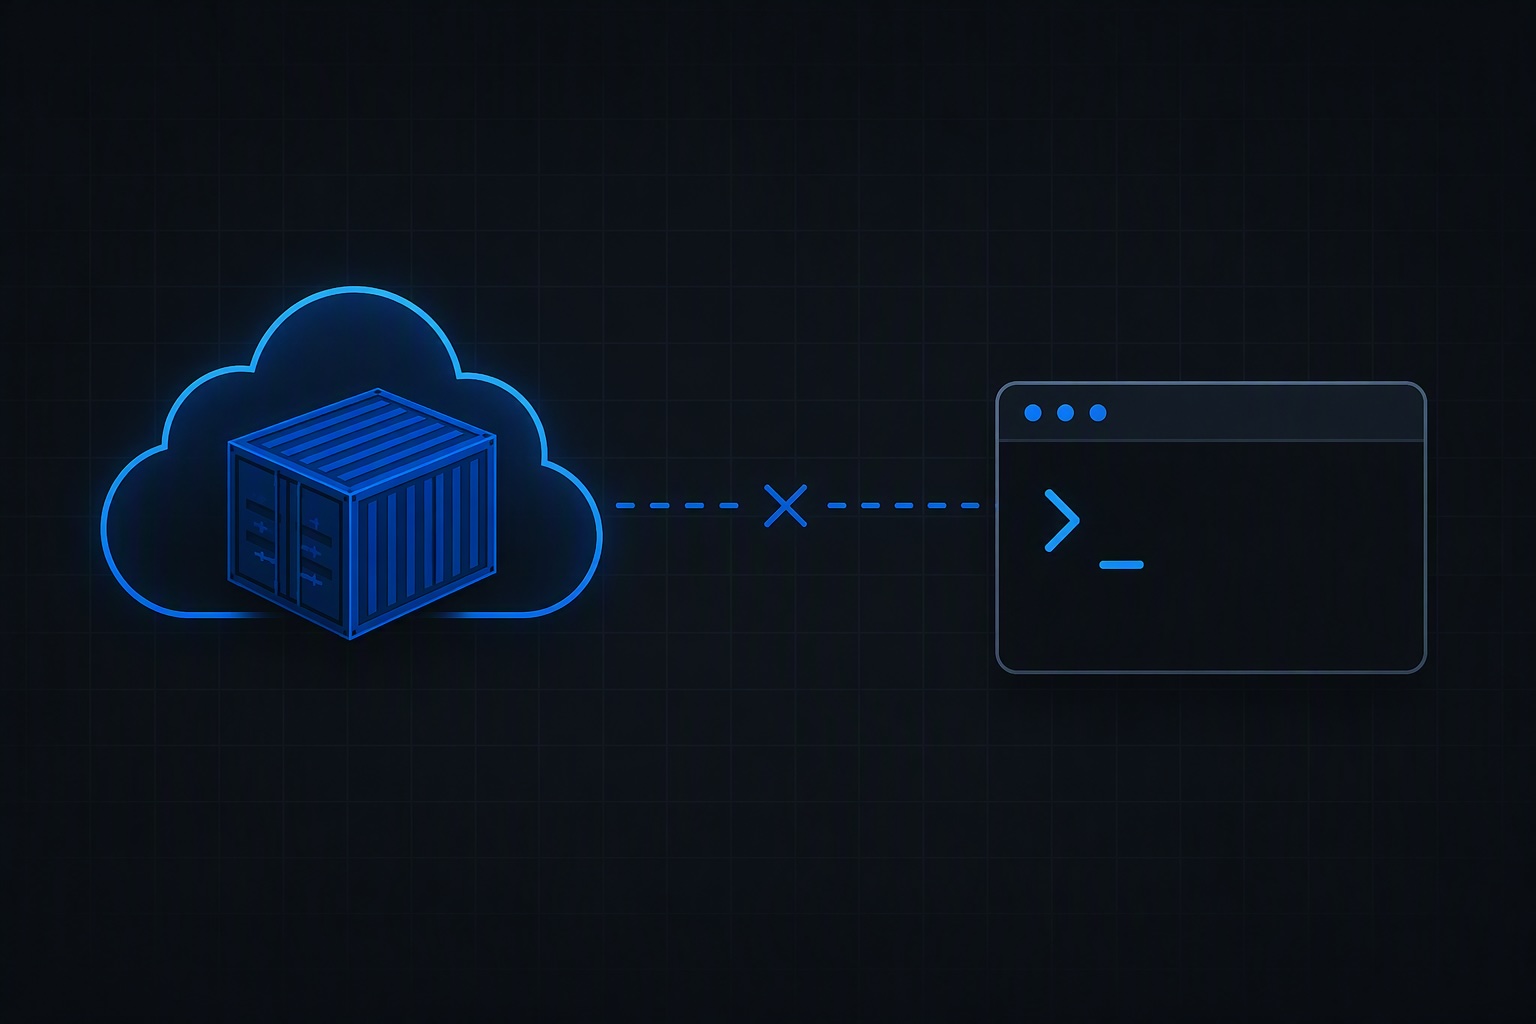
If you’ve spent any real time running workloads on Azure Container Apps, you’ve probably hit this moment: you open the Console blade to poke around inside a running replica, or you fire off az containerapp exec, and instead of a shell prompt you get a spinner, a cryptic JSON error, or nothing at all. No stack trace pointing at your app code. No obvious misconfiguration in the portal. Just a broken connection and a vague sense that the platform is hiding something from you.
This happened to me on an nginx-based container app that, on paper, had no business giving me trouble. Ingress worked. Requests were being served. Health checks were green. But every attempt to exec into the container either hung or failed outright — and the eventual answer had nothing to do with the platform being broken. It had to do with a decision my own team had made for good reasons: the image was distroless.
Ruling things out first
Before landing on the real cause, the failure looked exactly like it could have been any of the usual suspects, so I worked through them in order rather than guessing:
- Scaled to zero? No — Log Stream confirmed a replica was actually running.
- RBAC/auth issue? No — the CLI wasn’t returning an unauthorized handshake error, it was returning a failure after the connection was accepted.
- Pod recycled mid-deploy? No — this wasn’t happening during a revision rollout or scaling event; it failed consistently, every time, on a stable revision.
Ruling those out narrowed it fast: if the platform can reach the container and the container is genuinely up, but every exec attempt still fails, the next question isn’t “what’s wrong with the platform” — it’s “does the thing I’m asking the platform to launch even exist inside this container.”
The actual cause: no shell to launch
It didn’t. The image had been deliberately built as a minimal/distroless-style image — nginx and its runtime dependencies, and essentially nothing else. No bash. No sh. That was the point: fewer binaries in the image means a smaller attack surface, no shell for an attacker to pivot into if the container is ever compromised, and a meaningfully smaller image to scan, store, and pull.
Azure Container Apps’ console feature works by launching an executable inside the running container — you pick bash, sh, or a custom binary that exists in the image. When none of those exist, the exec request isn’t malformed and the platform isn’t misbehaving. There’s simply nothing on the other end to attach a shell to. The error messages don’t say this plainly, which is exactly what makes it look like a platform fault instead of an intentional trade-off doing exactly what it was built to do.
The trade-off, and what to do instead
This is a case where the “fix” isn’t really a fix — hardening the image and having interactive shell access are in direct tension, and you don’t get to have both at once on the same image. A few ways to handle it depending on what you actually need:
- Lean on log streaming as the primary debugging tool. If the image is distroless by design, structured application logging has to carry more of the debugging weight than it would on a shell-accessible image, because it’s the one thing that isn’t going away.
- Use the platform’s own ephemeral debug container pattern, where it exists, rather than trying to exec into the hardened image directly.
- Keep a debug variant of the image for non-production use as a fallback for platforms that don’t offer a built-in debug-container feature, or for scenarios the platform’s own tooling doesn’t cover.
None of these are exotic — they’re the same trade-offs distroless images force on any orchestrator. The difference is just how opaque the platform’s own error surface is about telling you that’s what’s happening.
What actually got me back in
This is the part that turned out to matter most: Azure Container Apps ships a purpose-built version of the ephemeral debug container pattern, specifically for this scenario. Instead of az containerapp exec, which launches an executable inside the target container itself, az containerapp debug spins up a separate companion container that shares the running replica’s underlying resources — same network path, same visibility into what the app is doing — without touching the hardened image at all.
In practice, that meant pointing the debug command at the specific revision, replica, and container rather than the app as a whole:
# Find the revision
az containerapp revision list \
  --name my-nginx-app \
  --resource-group my-rg \
  --query "[].name"

# Find the replica for that revision
az containerapp replica list \
  --name my-nginx-app \
  --resource-group my-rg \
  --revision <revision-name>

# Attach a debug container alongside it
az containerapp debug \
  --name my-nginx-app \
  --resource-group my-rg \
  --revision <revision-name> \
  --replica <replica-name> \
  --container <container-name>
That drops you into a shell in a companion container sitting next to the hardened one, sharing its resources, without adding a single debugging binary to the production image. Two details worth knowing before you lean on this: the platform reuses an existing debug container for a given replica instead of spinning up a fresh one on every connection, and it only allows one running debug container per replica at a time — so this is built for an active troubleshooting session, not something you leave running as a permanent sidecar.
Built-in tools in the debug console
The following diagnostic tools are preinstalled to the debug console to help you troubleshoot issues:
- ip-utils
- net-tools
- procps
- lsof
- util-linux
- nc
- wget
- openssl
- traceroute
- ca-certificates
- bind-utils
- tcpping
If you want to install other tools, run the tdnf install -y <TOOL_NAME> command. Before you run this command, replace the <PLACEHOLDERS> with your container app’s values.
For example, install JDK in the debug console using the following command:
tdnf install -y msopenjdk-17Compared to maintaining a parallel debug build of the image, this is the better default wherever it’s available. It doesn’t add a second image to build, scan, and keep in sync with production. It doesn’t touch the hardened image’s contents at all. And it goes away the moment you’re done with it.
The platform engineering takeaway
The part worth carrying into a landing zone or internal platform catalog isn’t “distroless breaks exec” — every team that’s used minimal images already knows that in the abstract. It’s that the failure mode is indistinguishable from a real platform fault until someone’s spent time ruling out scaling, auth, and pod lifecycle issues first. That’s wasted time you can design away:
- Tag approved base images in your internal catalog as shell-accessible or shell-free, so teams know before they hit a wall in production which debugging strategy applies to them.
- Document
az containerapp debugas the default recovery pattern for hardened images in your team runbooks, ahead of reaching for a custom debug-variant image. - Document the “rule-out order” — scale state, then auth, then deploy timing, then image composition — as a first response step wherever your teams go to troubleshoot container apps, so distroless-related failures get identified in minutes instead of after a detour through everything else first.
Security-hardened images are the right default for a lot of workloads. The goal isn’t to avoid that trade-off — it’s to make sure nobody has to rediscover it the hard way at 2am.
Discover more from ksharp
Subscribe to get the latest posts sent to your email.