As a developer you’re probably familiar with the pain of troubleshooting web applications. In Azure App Services you have a rich set of different tools to help you make this troubleshooting a lot easier. In this post though we are going to discuss the latest addition of these tools, the Azure App Service support.
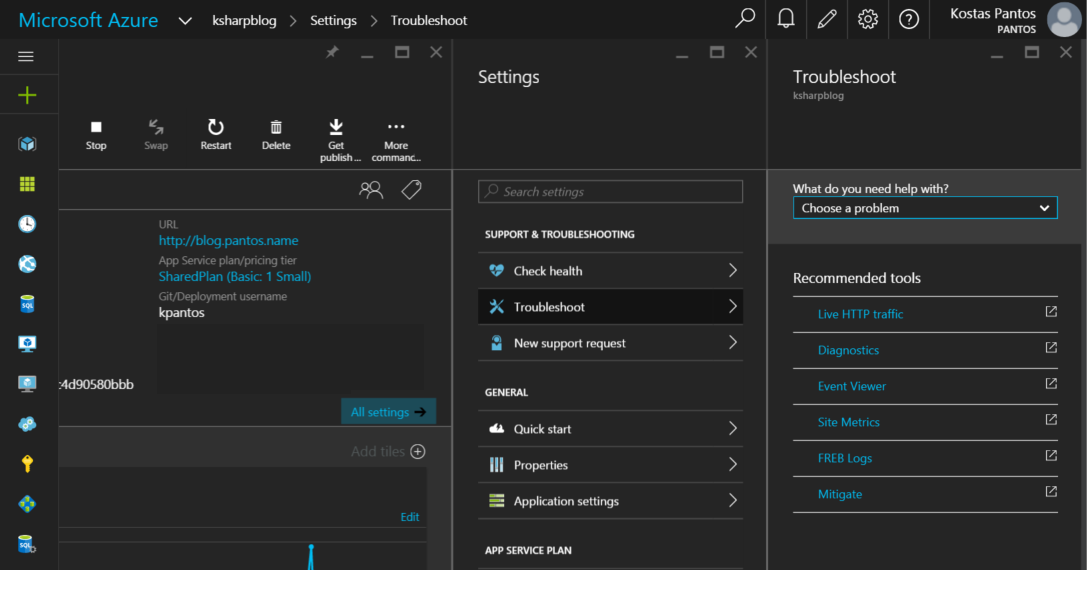
To access the tool you can click on any of the troubleshoot blade links as shown in the picture. The Azure App Service support web application will open on a new web page and present you with three troubleshooting sections. Note that, if your live id is associated with more than one subscriptions (Active directories) you will first have to select the subscription you want to work with and the web app you want to troubleshoot from the drop down menu on the header.
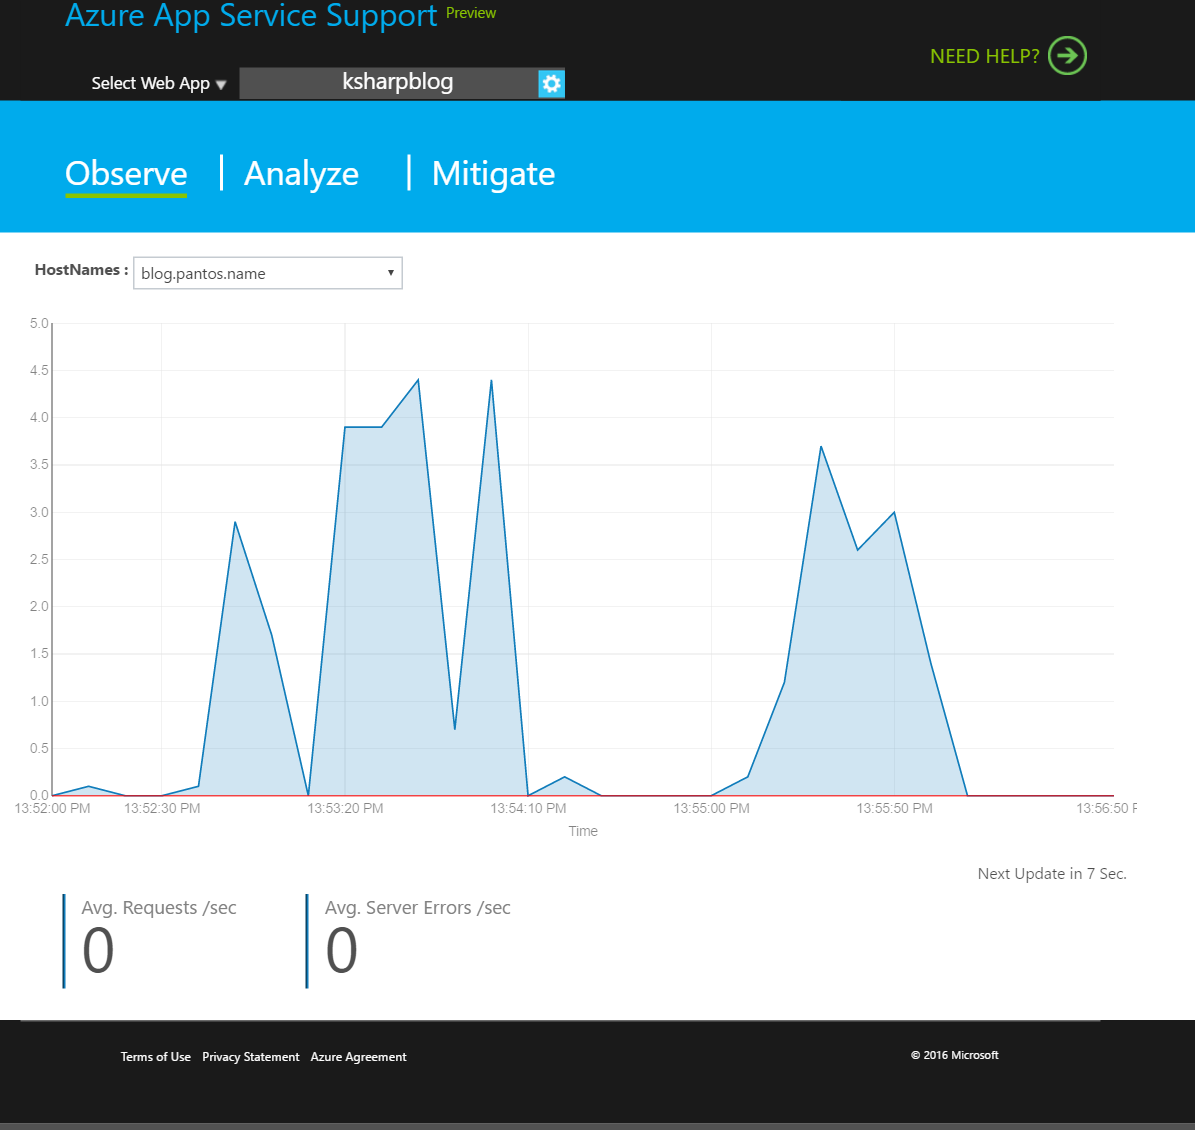
Observe:
In this first section you will be able to monitor – see the average requests per second and average server errors per second your web app is serving in real time.
Analyze:
This is probably the most useful section of the application as through it you will be able to
- Configure your diagnostics settings for your web app and download web diagnostics (note that you will have to configure your app to produce these) like:
- Event viewer logs
- Memory dumps
- Http Logs
- PHP Error Logs
- PHP process Report
- Node Process Report

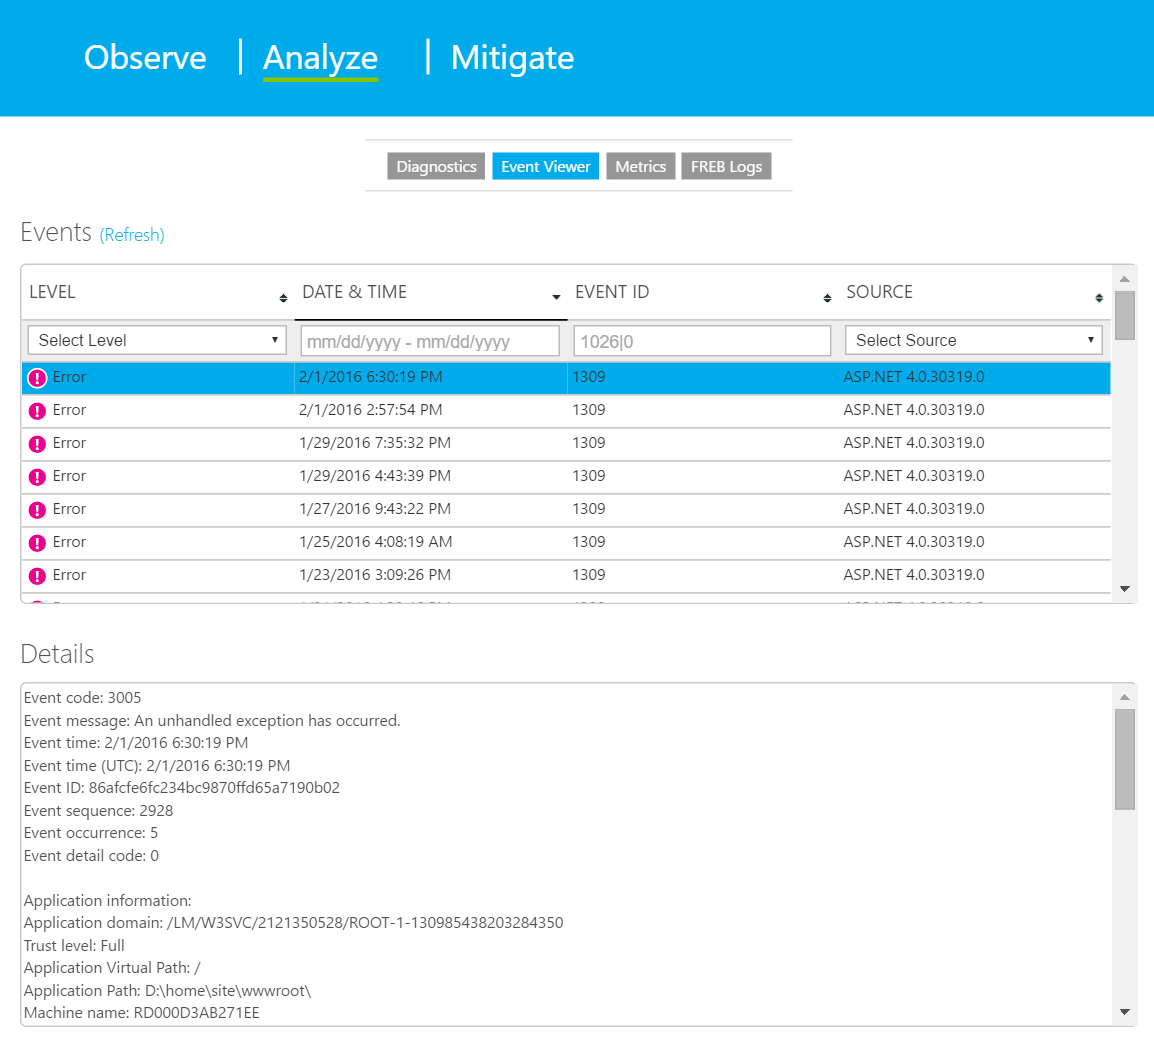
- Take a pick on the Event Viewer and identify, using rich filtering capabilities, possible issues that might be causing problems in your web app.
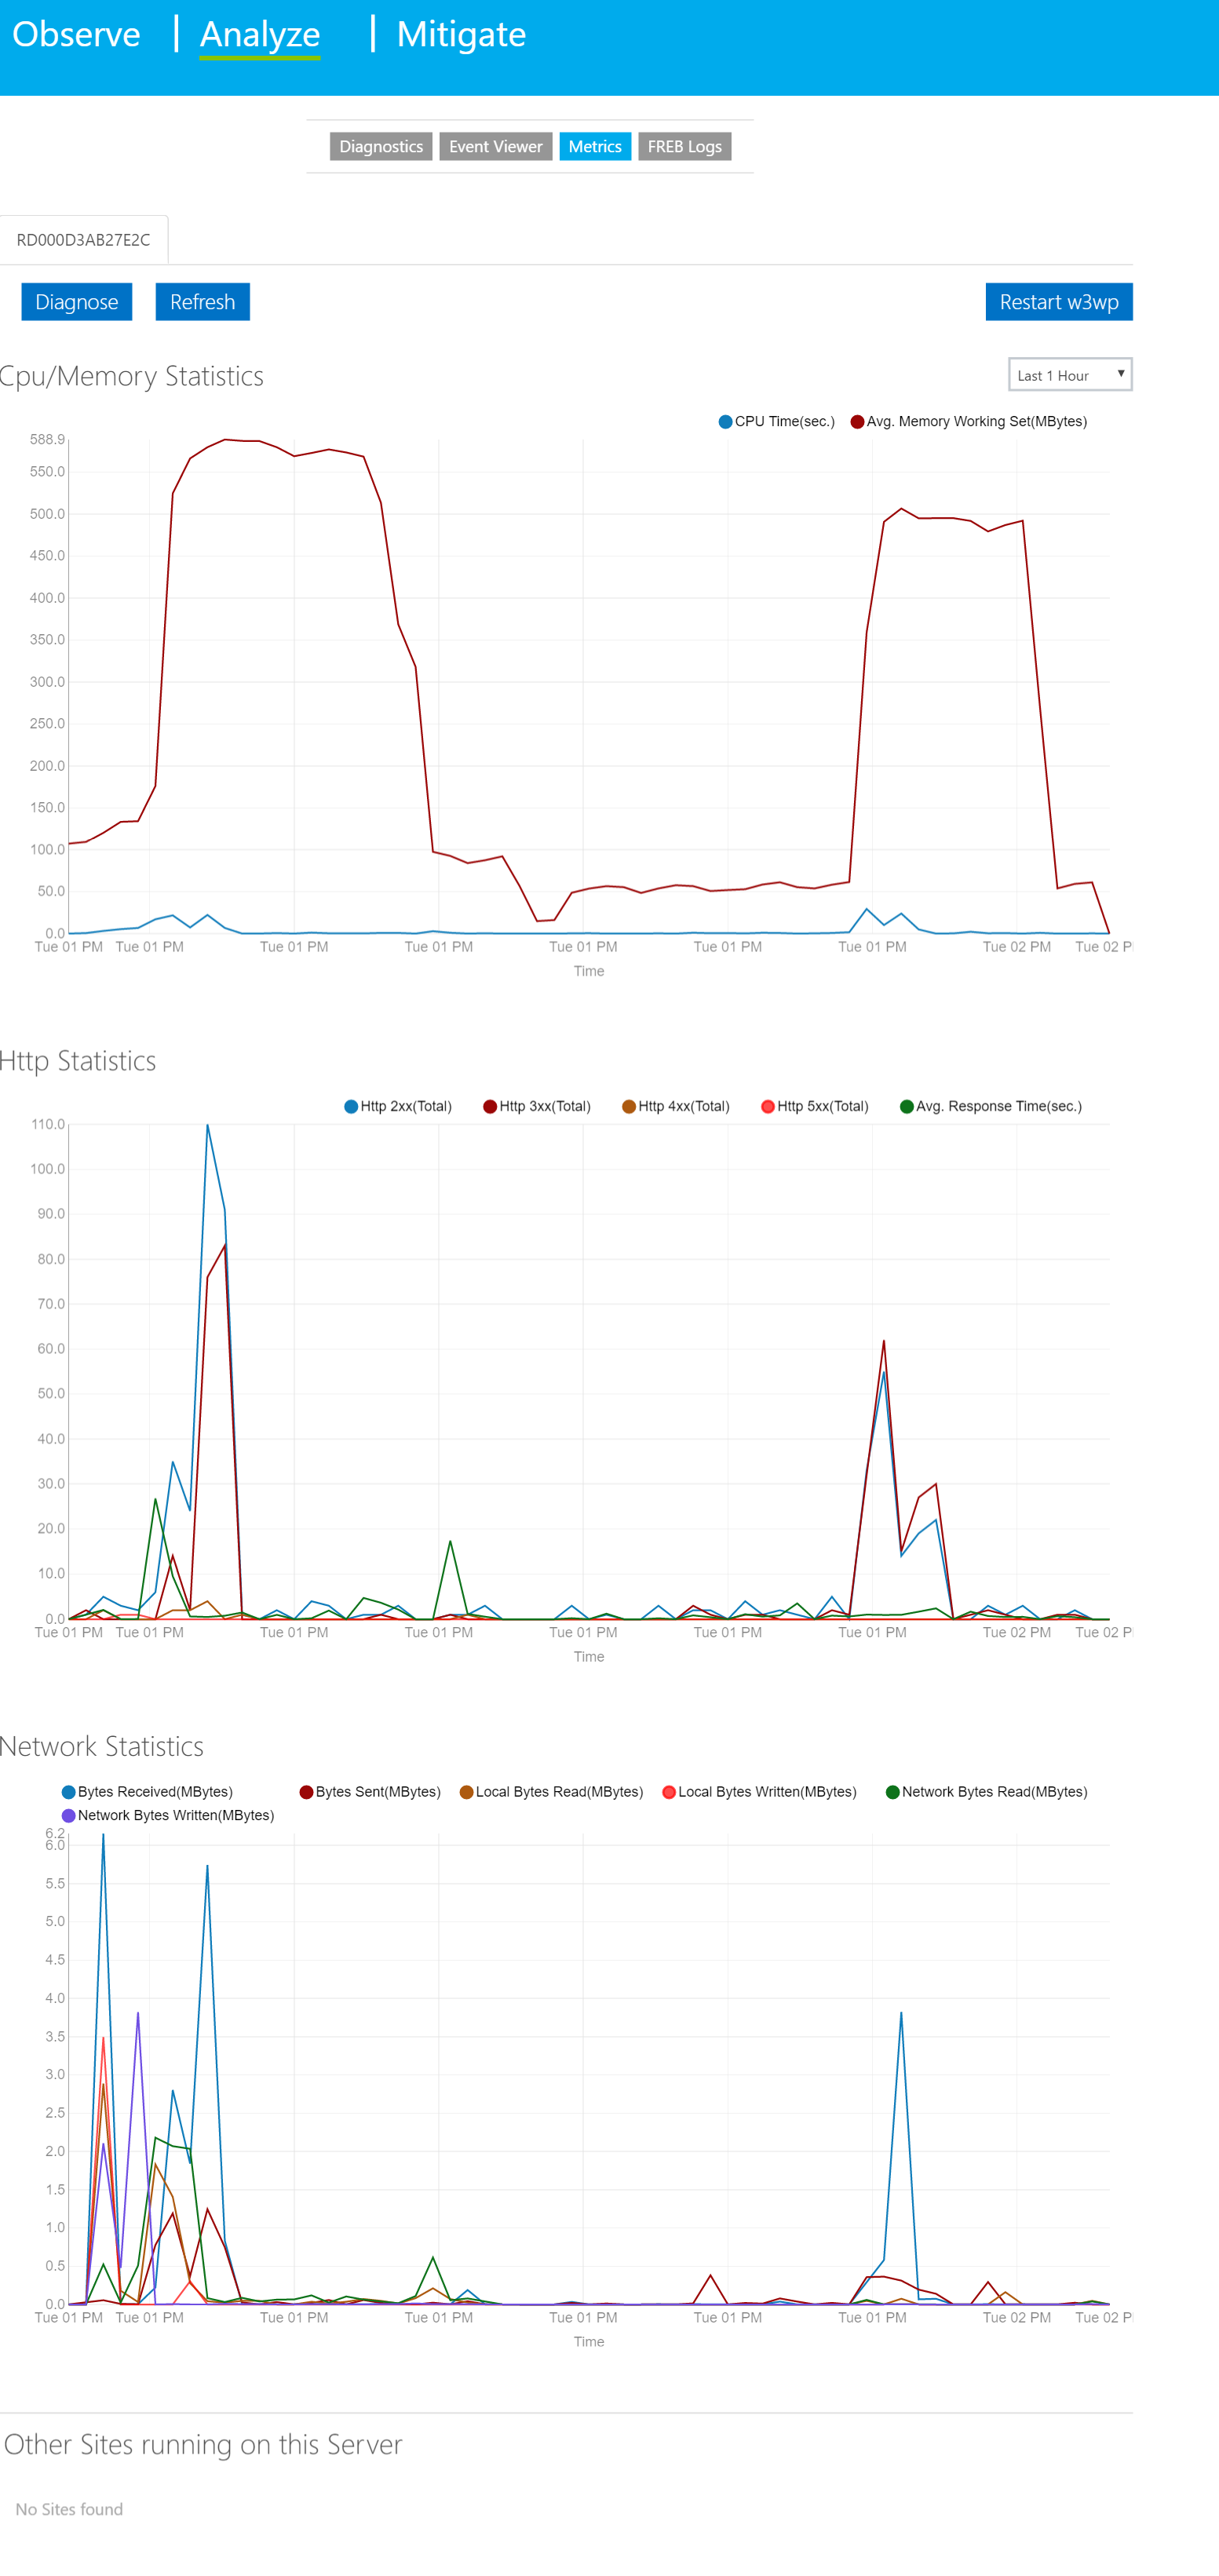
- See various metrics and statistics like CPU and memory utilization, http and networking statistics for your web app as well as restart the w3wp process hosting your web application and see other sites that might be running on the same server in the case of using the shared hosting plan.
- See application emitted FREB logs
Mitigate:
Using this section you can specify rules for mitigating possible problems in your web app.
So you can mitigate for:
- Max Requests: Consider a scenario where you have a need to recycle your application automatically after it has served X number of requests in Y amount of time. You know that it just doesn’t scale well after huge influx of requests in short amount of time. You want to detect this condition and recycle worker process automatically or log an event or Run a custom action.
- Status Code: Consider a scenario where you would like to get notified of a situation when your web Web App starts throwing specific HTTP status codes, sub-status code or win32 status codes. You can chose to recycle or simply log an event or Run a custom action.
- Slow Requests: Consider a scenario where the performance of your application starts degrading and several pages start taking longer time to render. You would like to detect this situation and recycle worker process automatically or log an event or Run a custom action.
- Memory Private Set: Consider a scenario where you have a need to recycle your application when your worker process hits specified memory limit (private bytes in Kb). You can chose to recycle or simply log an event or Run a custom action.
Hope you enjoy this as much as I do.
[…] you’re probably familiar with the pain of troubleshooting web applications. In Azure App Read more Share Δημοσίευση στην κατηγορία: Microsoft […]