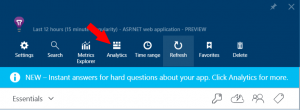
 When running many services at large scale, you rely very heavily on telemetry to help you understand what’s happening across your services and to detect, diagnose and repair problems. Application Insights Analytics, is a near realtime log analytics platform for interactive data exploration that enables you to do amazing things. While Application Insights has had a log search capability for a good while now, Analytics takes it to a whole new level.
The Application Insights Analytics preview ingests any data the Application Insights SDK sends – built in or custom and allows you to query over it easily from a browser.
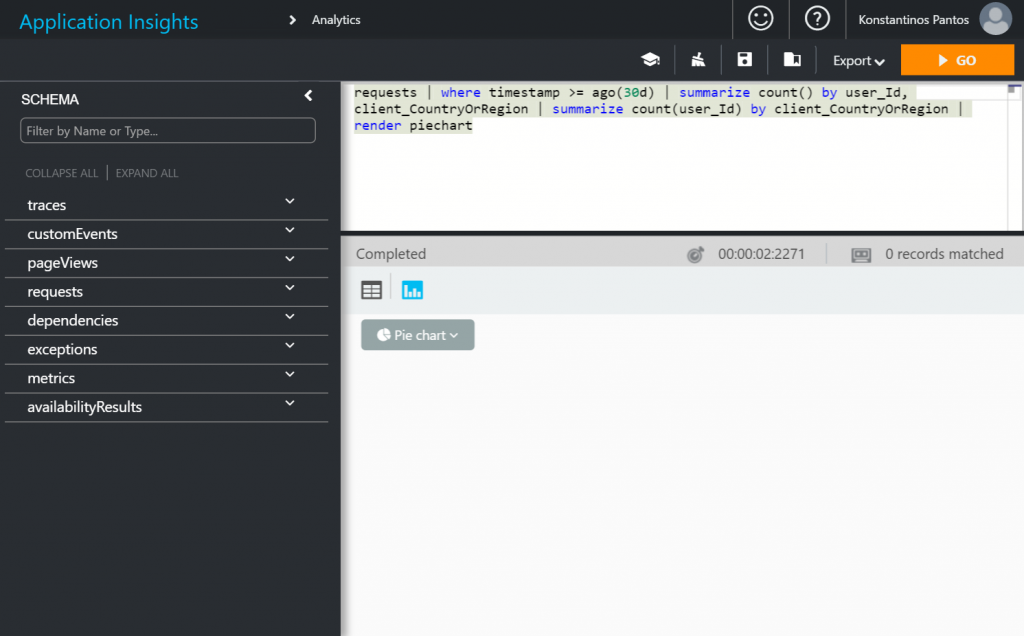
Here’s a very simple query. “requests” is the name of the table we are querying data from. “timestamp” is a field name that identifies when a datapoint was collected. “summarize” is a little like a SQL group by expression. “order by” says to sort the data by count, descending. Each of these clauses are strung together in sequence by a pipe operator “|”. “count_” is the auto generated field name for the count() of requests for each CountryOrRegion.
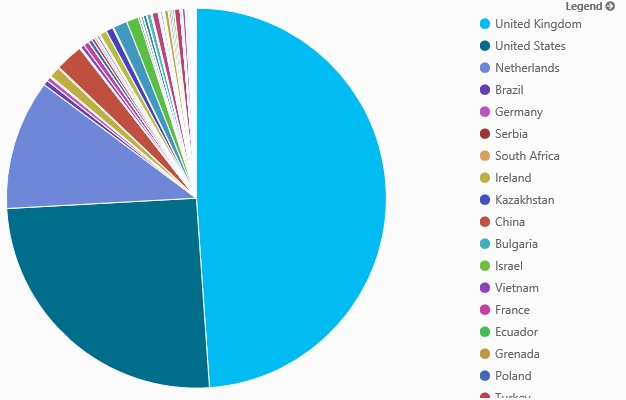
The result will look something like that
That’s just a tiny taste of the kinds of things you can do with Application Analytics. It’s very powerful. You can read more about it in theApplication Insights Analytics docs. You can also run queries over the log data and export the results to PowerBI and use the full reporting power of Power BI to create great visualizations. For the moment, there’s an 8 days retention. Over time, more retention options will be made available – but 8 days is generally plenty for trouble shooting of live site incidents.


[…] When running many services at large scale, you rely very heavily on telemetry to help Read more Share Δημοσίευση στην κατηγορία: Microsoft […]